(Part 1 can be found here.)
Last time, I talked about using typeperf to collect Perfmon performance data and store it in SQL Server. This time around, I’ll talk about how to pull that data out and make some pretty reports with it.
First off, we’ll need some SQL code to pull the data and do some calculations on it. If you recall, my process collects four data points, 15 seconds apart, every 30 minutes. For my reporting, I’m going to take the average value of those four data points and use that as a single data point for that time period. I opted to make a view for this and, when designing this view, I’m keeping in mind that it will ultimately be used for a report, so that explains why I do some of the formatting that I do. I will say right now that the performance of this method leaves something to be desired. This is very much a first pass attempt and you’ll notice the view calculates things I never use – such as max and min values for each collection set. The whole thing should probably get replaced with one or more stored procedures, which should help the report run faster. This is left as an exercise for the reader :-)
As I mentioned before, the names of the SQL Server Perfmon counters vary depending on if your SQL Server is a named instance or not. Default instances have counter names of the format SQL Server: <counter name>. Named instances have counter names of the format MSSQL$:<instance name>: <counter name>. For reasons that will become apparent later, I want the counter name to be the first part of the string, not the SQL Server instance name. So I opted to format the counter name in the view to be <counter name>: SQL <instance name> Instance. If this is the default instance, <instance name> is replaced with “Default.”
I also make the Page File % Usage counter name a bit more user-friendly, changing it from “% Usage” to “Page File % Usage.”
The other thing the view does is format the display string (remember the string after the ! in the batch file?) to be in a date format by adding slashes where appropriate. This helps the report identify the data as a date value. (I probably could have done this in the batch file when the ! tag was generated, but I’m pretty sure I’d have to escape all those slashes and I didn’t want to go there.)
Here is the code for the view:
CREATE VIEW [dbo].[vw_PerfmonStats]

AS

SELECT  cdt.MachineName,
        CASE
        	WHEN cdt.ObjectName LIKE 'SQLServer:%' THEN cdt.CounterName + ': SQL Default Instance'
        	WHEN cdt.ObjectName LIKE 'MSSQL$%' THEN
        		cdt.CounterName + ': SQL ' + SUBSTRING(cdt.ObjectName,CHARINDEX('$',cdt.ObjectName)+1,CHARINDEX(':',cdt.ObjectName)-CHARINDEX('$',cdt.ObjectName)-1)
        		+ ' Instance'
        	WHEN cdt.CounterName =  '% Usage' THEN 'Page File % Usage'
        	ELSE cdt.CounterName
        END AS CounterDisplayName,
        cdt.InstanceName,
        MIN(cd.CounterValue) AS minValue,
        MAX(cd.CounterValue) AS maxValue,
        AVG(cd.CounterValue) AS avgValue,
		CAST(LEFT(d.DisplayString,2) + '/' + SUBSTRING(d.DisplayString,3,2) + '/' + SUBSTRING(d.DisplayString,5,4)
		 + ' ' + SUBSTRING(d.DisplayString,10,2) + ':' + RIGHT(d.DisplayString,2) AS DATETIME2) AS FormatedDateTime
FROM    dbo.CounterDetails AS cdt
        INNER JOIN dbo.CounterData AS cd ON cdt.CounterID = cd.CounterID
        INNER JOIN dbo.DisplayToID AS d ON d.GUID = cd.GUID
GROUP BY cdt.MachineName,
        cdt.ObjectName,
        cdt.CounterName,
        cdt.InstanceName,
        d.DisplayString
Now that the view has been defined, it’s time to create a report. I use Visual Studio 2008 for my report design work.
When designing reports, I like to keep in mind the intended audience for the report. In this case, the audience will be not only DBAs, but also managers. This is because I want to use these reports to illustrate the need for some sort of change. With that in mind, I want to make the reports as self-explanatory as possible. I’m collecting a lot of Perfmon data and there is a good chance the managers aren’t going to know what each counter represents. Heck, there’s a good chance in 6 months, I’ll forget what each counter represents! I also want the report to list what acceptable values should be. In short, I want to be able to look at the report and have all the information I need to determine if the chart shows acceptable performance or not.
To that end, I decided that the report should have a text box that tells a little bit about the counter it is showing and what the range of acceptable values is. The brute force method would be to make a separate report for each counter, but that seems like a waste of effort and a maintenance headache. The method I settled on was to create multiple text boxes, only one of which will actually be displayed on the report, based on the counter that is being displayed. If other words, conditional formatting.
So I created a new report in Visual Studio. My main data source is my view created above. I made two parameters for the report: @MachineName and @CounterName. These two parameters are defined to have available values from two datasets: ds_Machines and ds_Counters. The ds_Machines dataset is simply a query selecting the distinct machine names from the view. The ds_Counters dataset selects the distinct machine names and counter names from the view.
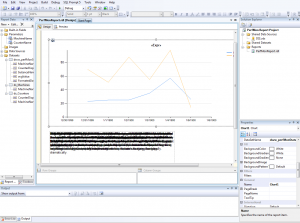
You’ll notice the title of my chart is an expression. I’ve defined this to be:
=Parameters!MachineName.Value + ” – ” + Parameters!CounterName.Value
Also notice the chart legend, which is partly cutoff in my screenshot. Some counters, such as disk-related counters, have mutliple values – one for each drive plus a total. Other counters just have a single value. I’m going to get a bit fancy and do some more conditional formatting with the legend box. If there is only one counter, I don’t want to display it. If there is more, I want it displayed. More on this later.
And now to the big black blob under the chart. That is actually seventeen text boxes stacked on top of each other – one for each counter I am collecting data for. Each box contains a short description of the counter and what recommended values for the counter are. I got this information from Brent Ozar’s video on Perfmon counters which can be found here. The magic happens with conditional formatting, which will hide all the text boxes except the one for the counter that the report is displaying. Here’s how that works.
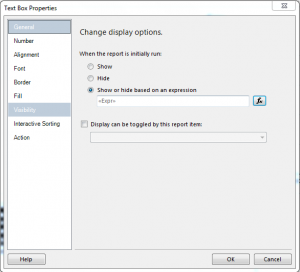
One of the text box properties is called Visibility. You can set the property to show or hide the box based on an expression.
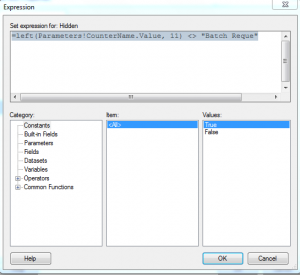
When you define the expression there a couple of things to note. First, the expression is for when the box is hidden. In other words, when the expression evaluates to True, the box does not display. The second thing to note is that there is no NOT LIKE operator available here. Don’t ask me why. Remember above when I said I wanted the counter name to the first part of the string and not the SQL Server instance name? This is why. By setting things up this way, I can use the LEFT function and look at the start of the counter name to determine if the text box should be displayed. Here is the Visibility expression for the text box for the Batch Requests Per Second counter:
Using this same method, we can hide or display the Legend box. Of the counters I am collecting, there are a couple where I want the Legend box to display. This is my expression for the Visibility property of the Legend box:
=left(Parameters!CounterName.Value, 6) <> “% Disk”
AND left(Parameters!CounterName.Value, 18) <> “Avg. Disk sec/Read”
AND left(Parameters!CounterName.Value, 18) <> “Avg. Disk sec/Writ”
AND left(Parameters!CounterName.Value, 14) <> “Disk Reads/sec”
AND left(Parameters!CounterName.Value, 15) <> “Disk Writes/sec”
AND left(Parameters!CounterName.Value, 11) <> “% Processor”
AND left(Parameters!CounterName.Value, 15) <> “Avg. Disk Queue”
Putting it all together, we get a rather nice report with dynamic notes. Deploy it to your SSRS server and we’re ready to go! Here are a few samples. Click to enbigen.
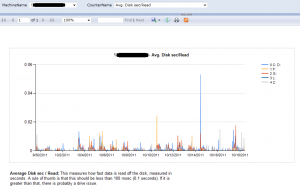
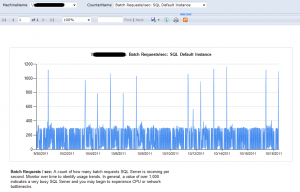
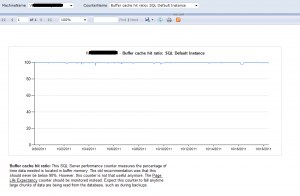
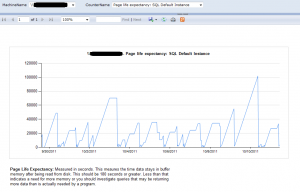
(I want to make a brief note about the text for the Page Life Expectancy chart. The text says a value of under 180 seconds is cause for concern. This is from Brent’s video, which is 5 years old now. Jonathan Kehayias of SQL Skills just published a blog post about this counter and why he feels a definitive number for this counter is not really a good benchmark to use. He advocates an adaptive formula. Brent chimes in in the comments, so be sure to read those and make your own decision as to this number’s relevance to your situation.)
That’s the very brief overview of creating a report from this data. I skipped a fair amount of steps with the assumption that readers would be familiar with creating an SSRS report in Visual Studio. If you have any questions, leave a comment and I’ll try to answer them.

Shaun,
These two pieces were exactly what I was needing. Sadly, I didn’t run into part one until I’d run up against nearly all of the gotchas you addressed in part 1. But the one I hadn’t figured out, you listed. Thanks for this. This is going to provide some really excellent insight across my multiple servers. I also really like the way you handled the reporting piece.
Keep up the good work!
Dave
Glad I was able to help! I really loved coming up with this whole process.